Silver at the Edge of History: A Structural Bull or Another False Dawn?
Viral Sheth
10/8/20254 min read
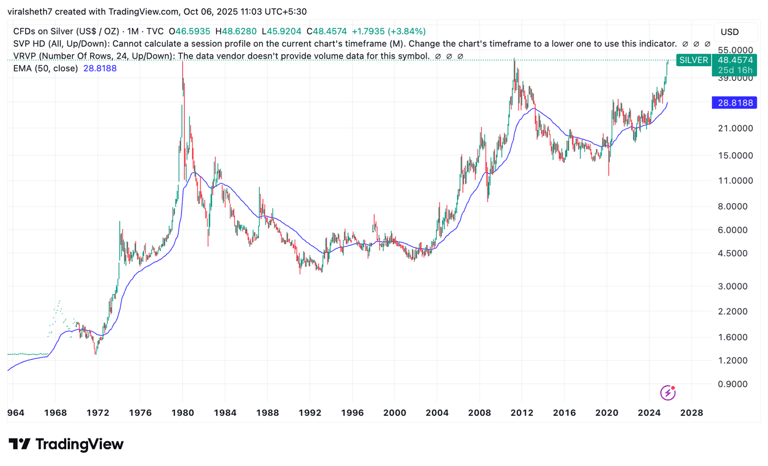
Every time silver nears $50 an ounce, it marks a turning point. In 1980, it was driven by one of history’s biggest market squeezes. In 2011, it reflected post-crisis optimism that quickly faded. Now, in 2025, silver is climbing toward that same level again but this time, the forces behind it look very different.
On the long-term monthly chart, silver is tracing a monumental cup-and-handle formation, spanning over a decade. The rim sits near USD 50/oz, tested twice, in 1980 and 2011. A decisive breakout above $50 would confirm a multi-decade structural bull market, potentially recalibrating the Gold–Silver ratio toward its historical range below 80:1
The Ghost of 1980: The Hunt Brothers and “Silver Thursday”
Is this another short-lived rally, or the start of a lasting bull market?
From Speculation to Structure: The Silver Market Has Changed

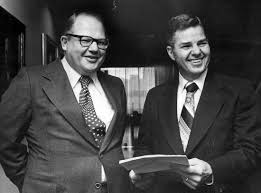
The story begins in the late 1970s, a world of double-digit inflation, soaring oil prices, and a declining U.S. dollar. Into this chaos stepped the Hunt Brothers, Texas oil billionaires who believed paper money was dying and tangible assets like silver were the future.
Between 1978 and 1980, they cornered nearly a third of the global silver supply, buying both physical metal and massive futures positions. Prices exploded from $6 to nearly $50 per ounce in less than two years, an eightfold surge that captured headlines worldwide.
But when the U.S. Federal Reserve under Paul Volcker raised interest rates above 15% to crush inflation, and regulators imposed “liquidation-only” trading on COMEX, the silver bubble burst spectacularly. By March 1980 known as “Silver Thursday”, silver had collapsed to below $11 per ounce, and the Hunt Brothers faced margin calls they couldn’t meet. The fallout triggered a multi-decade bear market. For over 20 years, silver languished in the $4–$6 range.
2011–2012 Echo: The QE Boom and Bust
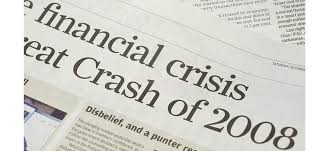
Fast-forward three decades. After the 2008 financial crisis, central banks started a policy called quantitative easing (QE), creating new money to support the economy. This made many people worry that currencies would lose value and inflation would rise. As a result, investors rushed to buy precious metals like silver and gold.
Between 2009 and April 2011, silver prices jumped from about $9 to nearly $49 per ounce, a rise similar to what happened in 1980. New investment products such as the iShares Silver Trust (SLV) made it easier for small investors to join the rally, and silver soon earned the nickname “the poor man’s gold.”
Then came the reversal. The Federal Reserve ended its QE2 program, which reduced the flow of easy money that had fueled speculative buying. The U.S. dollar grew stronger, fears of inflation faded, and industrial demand slowed as the global economy lost momentum. As prices dropped, traders faced margin calls, forcing them to sell their positions — and that triggered a chain reaction of selling across the market. By the end of 2012, silver was down nearly 40% from its highs, settling near $30/oz — the beginning of a long, grinding consolidation that would last the better part of a decade.
In 1980 and again in 2011, silver’s rallies ended when speculative demand collapsed and supply surged. But this time, the story is different. Silver’s strength is now being driven by structural demand growth and limited new supply, not by leveraged trades or market manias.
Rising Demand Meets Stagnant Supply
For nearly a decade after 2012, silver’s total supply (blue bars) consistently exceeded demand (yellow bars), keeping prices subdued.
Since 2021, that balance has flipped — global demand has surged while supply has barely grown.
This surge comes mainly from industrial uses, especially solar panels, electric vehicles, and electronics, all key parts of the green economy.
Even at higher prices, physical investment demand from India and global retail investors has stayed resilient.
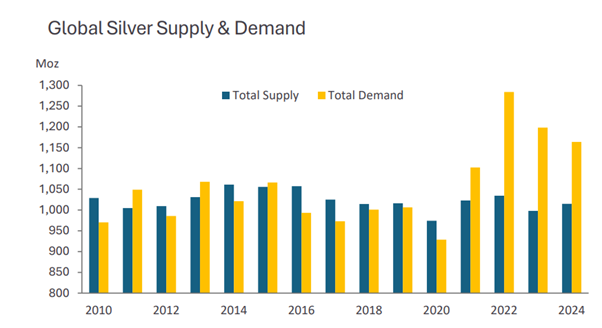
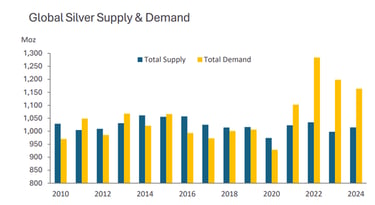
The Silver Institute: World Silver Survey 2025
Deficits Are Now Driving the Market
The chart shows how this imbalance has reshaped the price trend. After years of surpluses between 2012 and 2019, silver slipped into deficit territory starting in 2021, and the gap has only widened.
Cumulative unmet demand since then has crossed 800 million ounces, the largest shortfall in modern times. Prices have risen steadily in response, moving from around $15 to above $30 — not from speculation, but from real, persistent shortages.
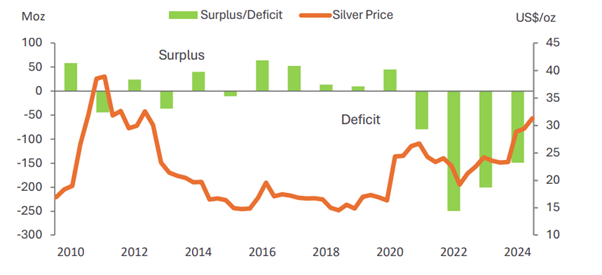

The Silver Institute: World Silver Survey 2025
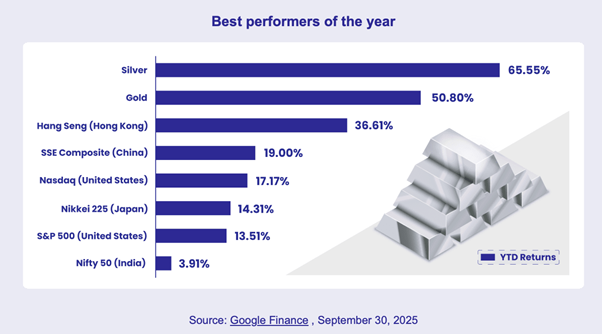
Performance Reinforces the Story
As of September 2025, silver is the best-performing major asset of the year, up 65.55%, outpacing gold (+50.8%), equities, and even tech-heavy indices. This momentum reflects both macro positioning and real physical demand, not just speculation.
The Road Ahead
History shows that silver’s path to $50 is never smooth, but each test has reflected a different world. Short-term corrections are likely, but investors who accumulate in the $35–44/oz range could be positioning for the next phase of a multi-year upcycle. If silver breaks above $50 with strong momentum, supported by real fundamentals rather than speculation — it could finally leave its 45-year price limit behind and set new record highs.
Contact Details

Finansys
33, 7th Floor; AC Market, Tardeo, Mumbai 34
Phone: +91 9930378858